Debugging on ESP8266
Required tools and hardware
A debugger is the only requirement for ESP8266. It is usually part of the provided toolchain. Make sure that you have the following executable in your PATH:
xtensa-lx106-elf-gdb
No additional hardware is required (Apart from a standard USB-to-UART adapter).
Recompilation is required
In order to debug applications based on Sming Framework make sure that you are using Sming version 3.8.0 or newer.
Framework
If you want to debug inside of the Sming Framework make sure to
(re)compile it with ENABLE_GDB =1 directive:
cd $SMING_HOME
make dist-clean
make ENABLE_GDB=1
The commands above will re-compile Sming with debug symbols and optimizations for debugging. These commands need to be executed once.
Application
To use, (re)compile your application with the ENABLE_GDB option and flash it to the board. For this example we will use the Live Debug sample application:
cd $SMING_HOME/../samples/LiveDebug
make clean
make ENABLE_GDB=1 # -- recompiles your application with debugging support
make flashapp # flashes ONLY the (re)compiled application
The device will restart then wait for a debugger to be connected:
make gdb
This will start a new debugging session where you can run your code interactively:
Remote debugging using /dev/ttyUSB0
gdbstub_init () at /home/slavey/dev/esp8266.dev.box/dev/Sming/Sming//gdb/gdbstub.cpp:914
914         gdb_do_break();
(gdb)
If the debugger is exited, the application will continue execution as normal. Re-connecting the debugger will pause execution.
GDB commands
There are multiple commands supported in GDB and we will mention only some of them.
List current source code
One possibility is to see the source code of the current line where the
execution has stopped. To achieve this you should type list in the gdb
console:
(gdb) list
909     SD(GDBSTUB_ENABLE_HOSTIO);
910 #undef SD
911
912 #if GDBSTUB_BREAK_ON_INIT
913     if(gdb_state.enabled) {
914         gdb_do_break();
915     }
916 #endif
917 }
918
Break the execution
This command will pause the debugger once it reaches a specific function
or line in the code. This is called breakpoint and can be set like this:
(gdb) break blink
Breakpoint 1 at 0x40105d4c: file app/application.cpp, line 66.
Notice: break sets a software breakpoint. This means that the
blink function must be in IRAM. Otherwise the execution will fail.
If you take a look at samples/LiveDebug/app/application.cpp#L663,
you will see a in the definition of the init function the following
attribute GDB_IRAM_ATTR:
void GDB_IRAM_ATTR init()
This attribute is used to put the init function in IRAM when the
code is compiled with the ENABLE_GDB=1 directive.
Continue the execution
To continue the execution of the application we can use the continue
command:
(gdb) continue
Continuing.
LiveDebug sample
Explore some capabilities of the GDB debugger.

[OS] mode : sta..
...
[OS] cnt

Breakpoint 1, blink () at app/application.cpp:66
66 {
(gdb)
Because we have set already a breakpoint for the blink function the
execution will be paused when the blink function is reached and from
here you can go to the next line or see the current values of the
variables.
Go to the next line
This can be done using next:
(gdb) next
67      digitalWrite(LED_PIN, ledState);
See variable value
The command to see a value is print followed by the name of the
value. For example to see the value of the ledState variable inside
the blink function we could type:
(gdb) print ledState
$1 = true
You can see more useful commands here.
Or watch the following short video
Debugging with visual debuggers like Eclipse CDT
A good visualization helps us understand things faster. What we can do is use Eclipse CDT and its debugging plugins to do remote debugging as we did from the command line.
Here is how this can be done:
Start Eclipse CDT and import the Live Debug sample:
Select File -> New -> Project -> C/C++ -> Makefile Project with Existing Code
Point Eclipse to the location of the LiveDebug sample
Import the Sming Framework (if you haven’t done it yet)
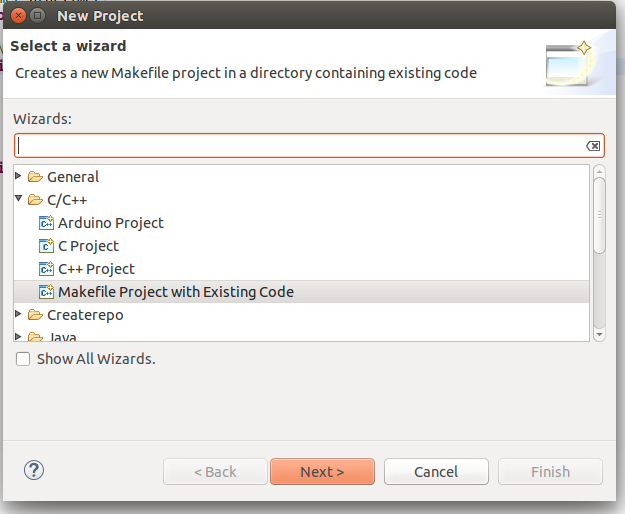
Import Project
Once the two projects are in Eclipse, set the LiveDebug project to reference the Sming project.
Now create a new Remote Debugging Configuration:
Select Run -> Debug Configurations -> C/C++ Remote Application
Right-click and create a new C/C++ Remote Application
In the Main tab set, set:
Project: Basic_Build
C/C++ Application: out/build/Esp8266/Debug/app.out
disable for now the auto build
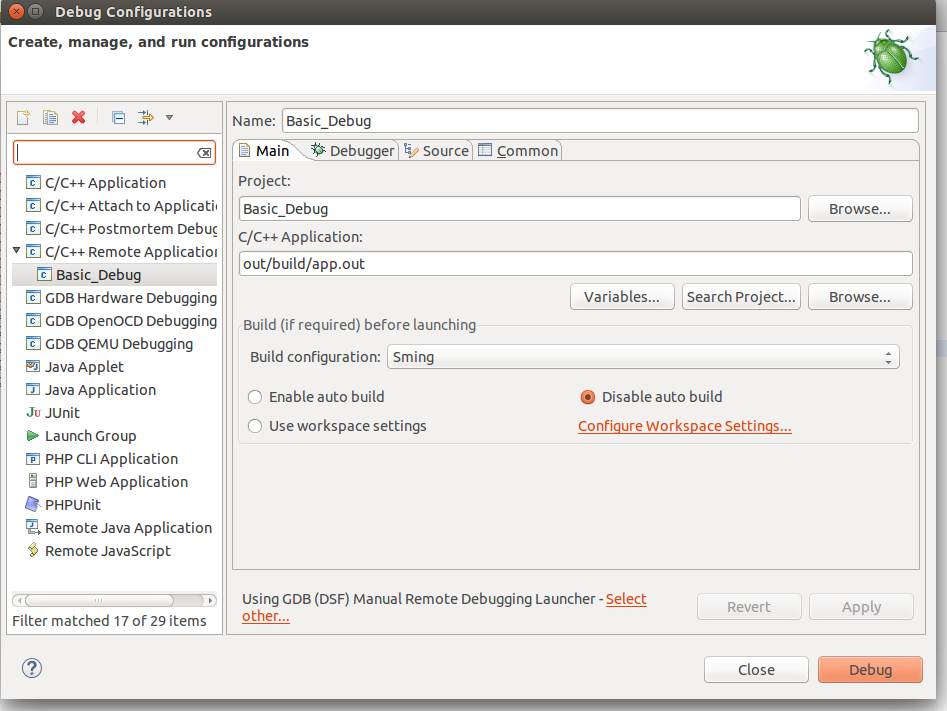
Remote Debugging Session
Then go to the Debugger tab and point the GDB debugger to your
Xtensa-gdb binary. (Type make list-config and look for GDB.)
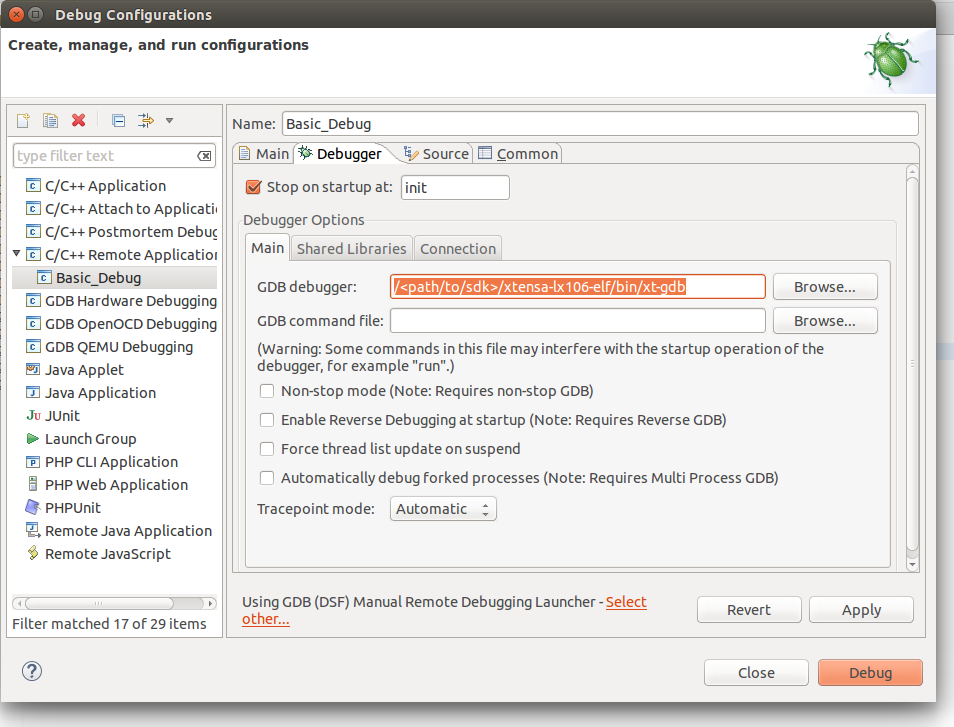
Remote Debugging Session
Make sure to load also GDB command file. To find out its location, run make list-config
and look for GDBSTUB_DIR. The file is called gdbcmds, and you may wish to place
a copy of the file somewhere else, especially if you intend to modify it.
You can see the file here Sming/Arch/Esp8266/Components/gdbstub/gdbcmds.
Finally we should configure the remote connection. Go to the Debugger -> Connection tab and set:
type: Serial
device: /dev/ttyUSB0 (or as required for your operating system)
speed: 115200
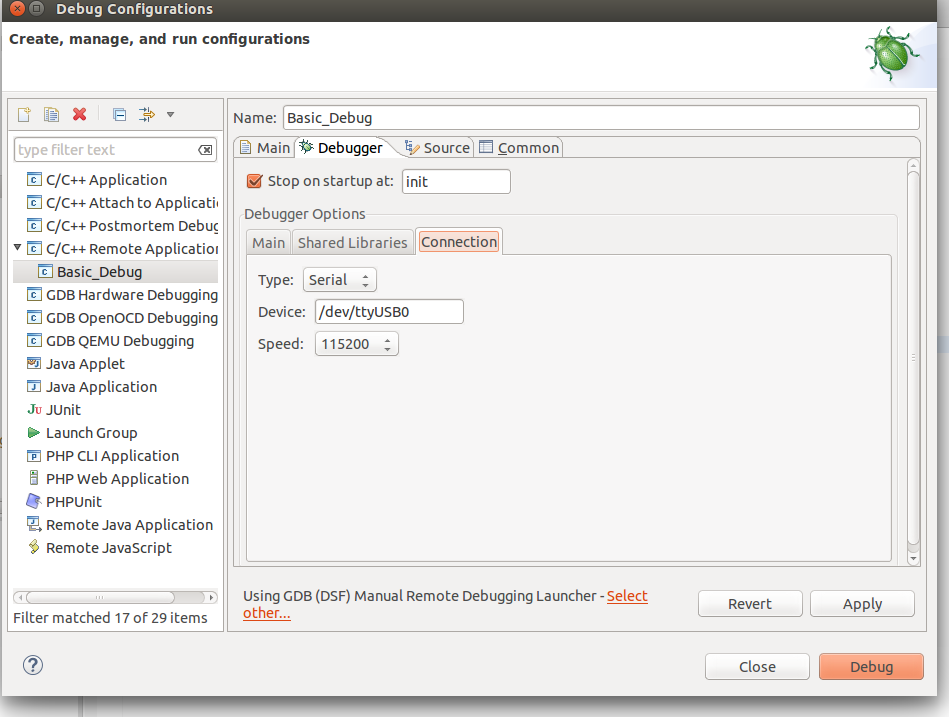
Set remote connection
We are now ready for debugging. Press the Debug button. (In the screenshot above the Debug button is in the bottom-right corner.) After some seconds your debugging session should be up and running and you can enjoy live debugging.
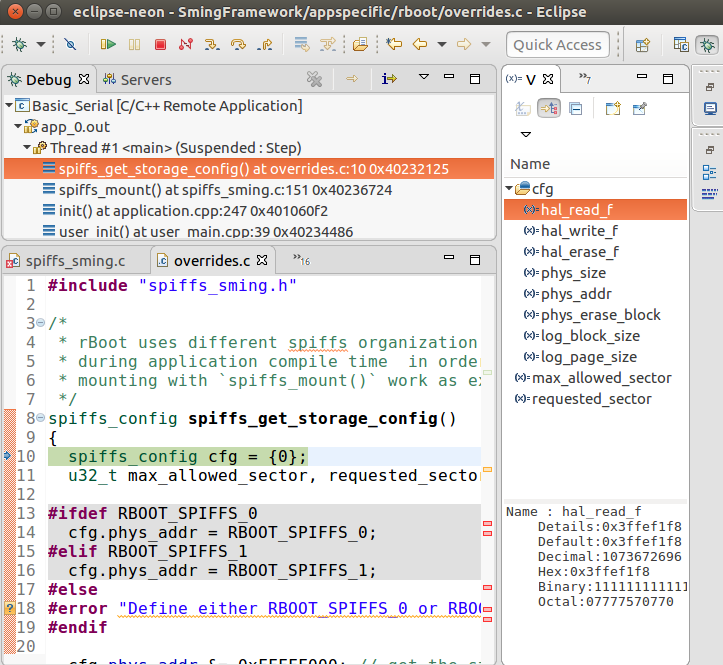
Live Debugging Session
You will be able to see the current variables and their values. You should be able to go step by step, go inside of functions, add breakpoints to code in RAM or add breakpoints to code that was in FLASH, after it was executed executed at least once.